Electron Debugging
There are many different approaches to debugging issues and bugs in Electron, many of which are platform specific.
Some of the more common approaches are outlined below.
Generic Debugging
Chromium contains logging macros which can aid debugging by printing information to console in C++ and Objective-C++.
You might use this to print out variable values, function names, and line numbers, amonst other things.
Some examples:
LOG(INFO) << "bitmap.width(): " << bitmap.width();LOG(INFO, bitmap.width() > 10) << "bitmap.width() is greater than 10!";
There are also different levels of logging severity: INFO, WARN, and ERROR.
See logging.h in Chromium’s source tree for more information and examples.
Printing Stacktraces
Chromium contains a helper to print stack traces to console without interrrupting the program.
#include "base/debug/stack_trace.h"...base::debug::StackTrace().Print();
This will allow you to observe call chains and identify potential issue areas.
Breakpoint Debugging
Note that this will increase the size of the build significantly, taking up around 50G of disk space
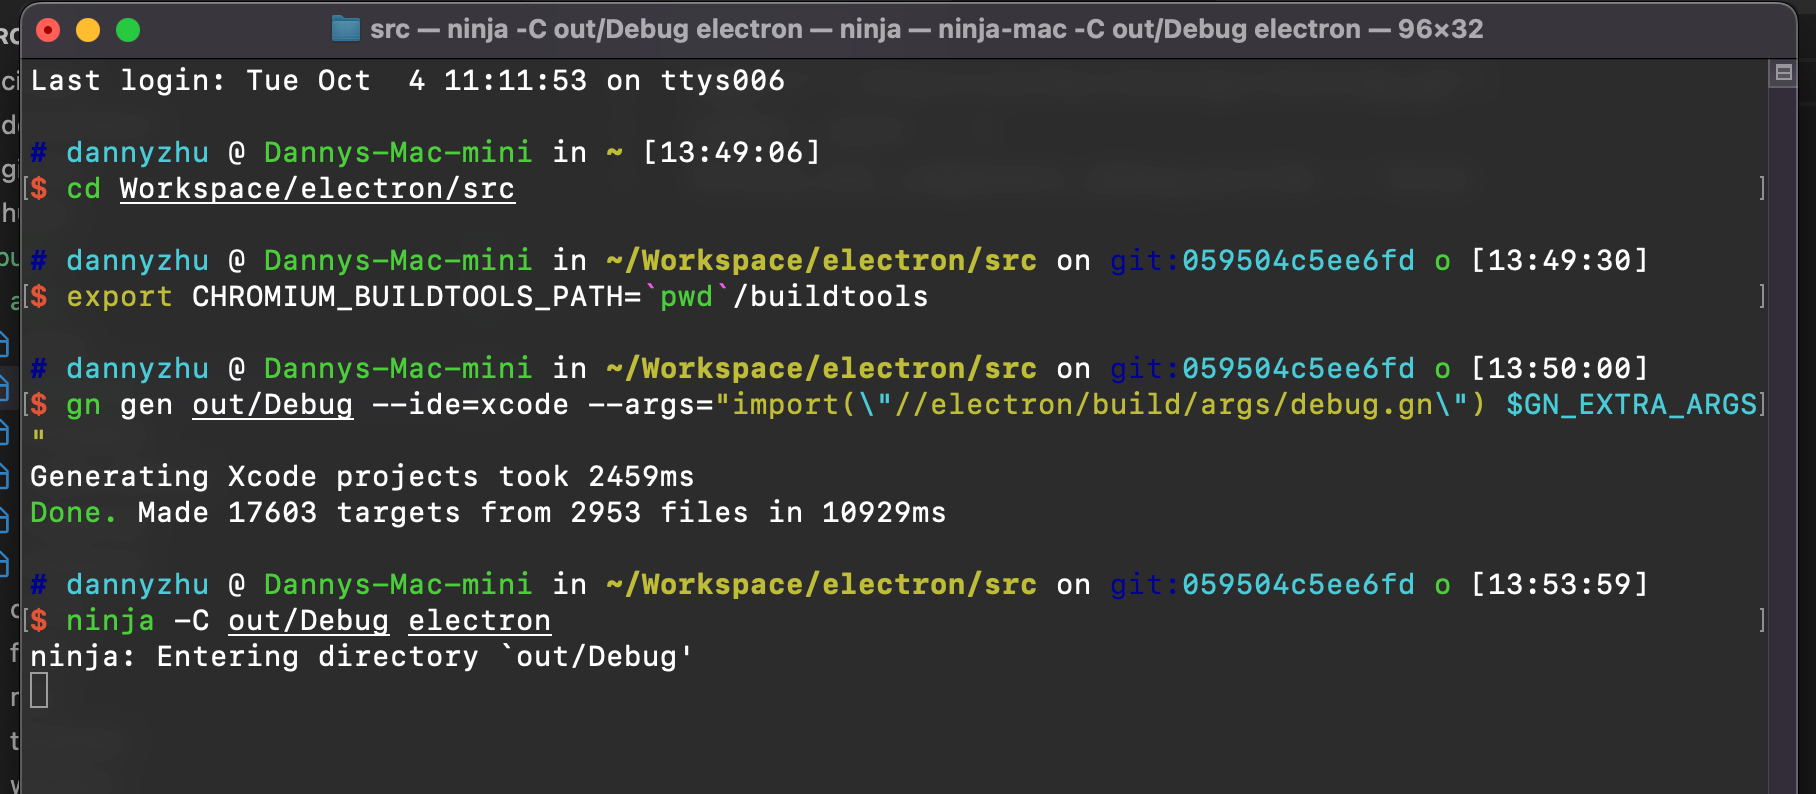
Write the following file to electron/build/args/debug.gn;
在这里笔者发现如果设置了is_debug会导致crash,原因是CHROMIUM_LLDBINIT_SOURCED没有设置;在实际调试过程中,我没有设置is_debug
import("//electron/build/args/testing.gn")is_debug = truesymbol_level = 2forbid_non_component_debug_builds = false
Then execute:
$ gn gen out/Debug --ide=xcode --args="import(\"//electron/build/args/debug.gn\") $GN_EXTRA_ARGS"$ ninja -C out/Debug electron
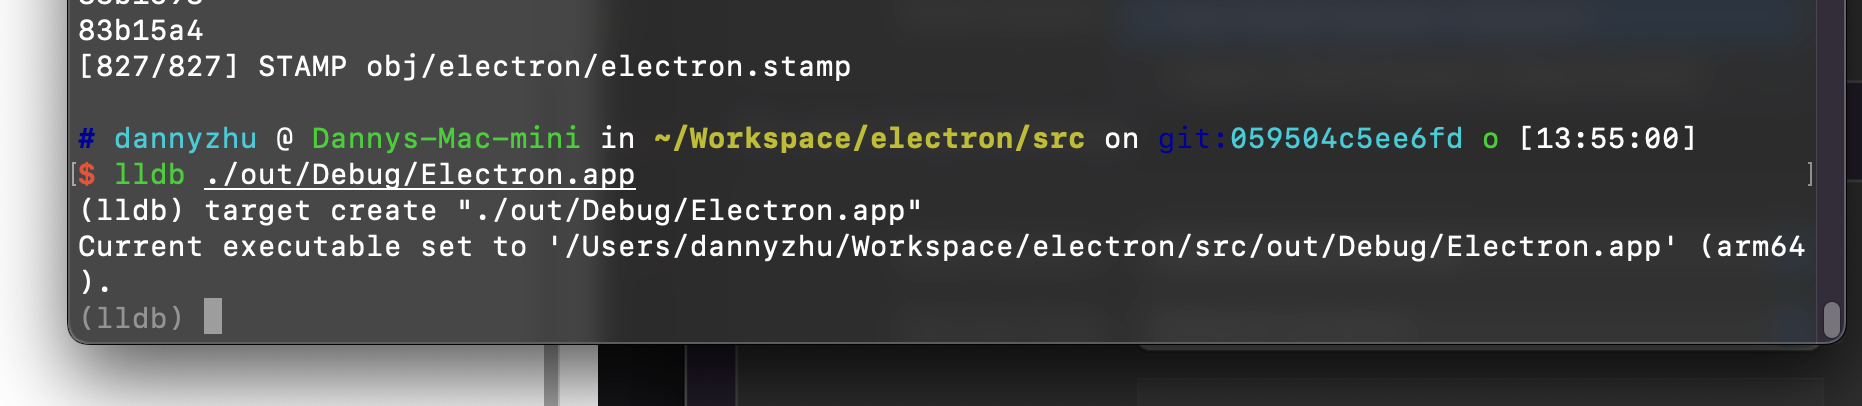
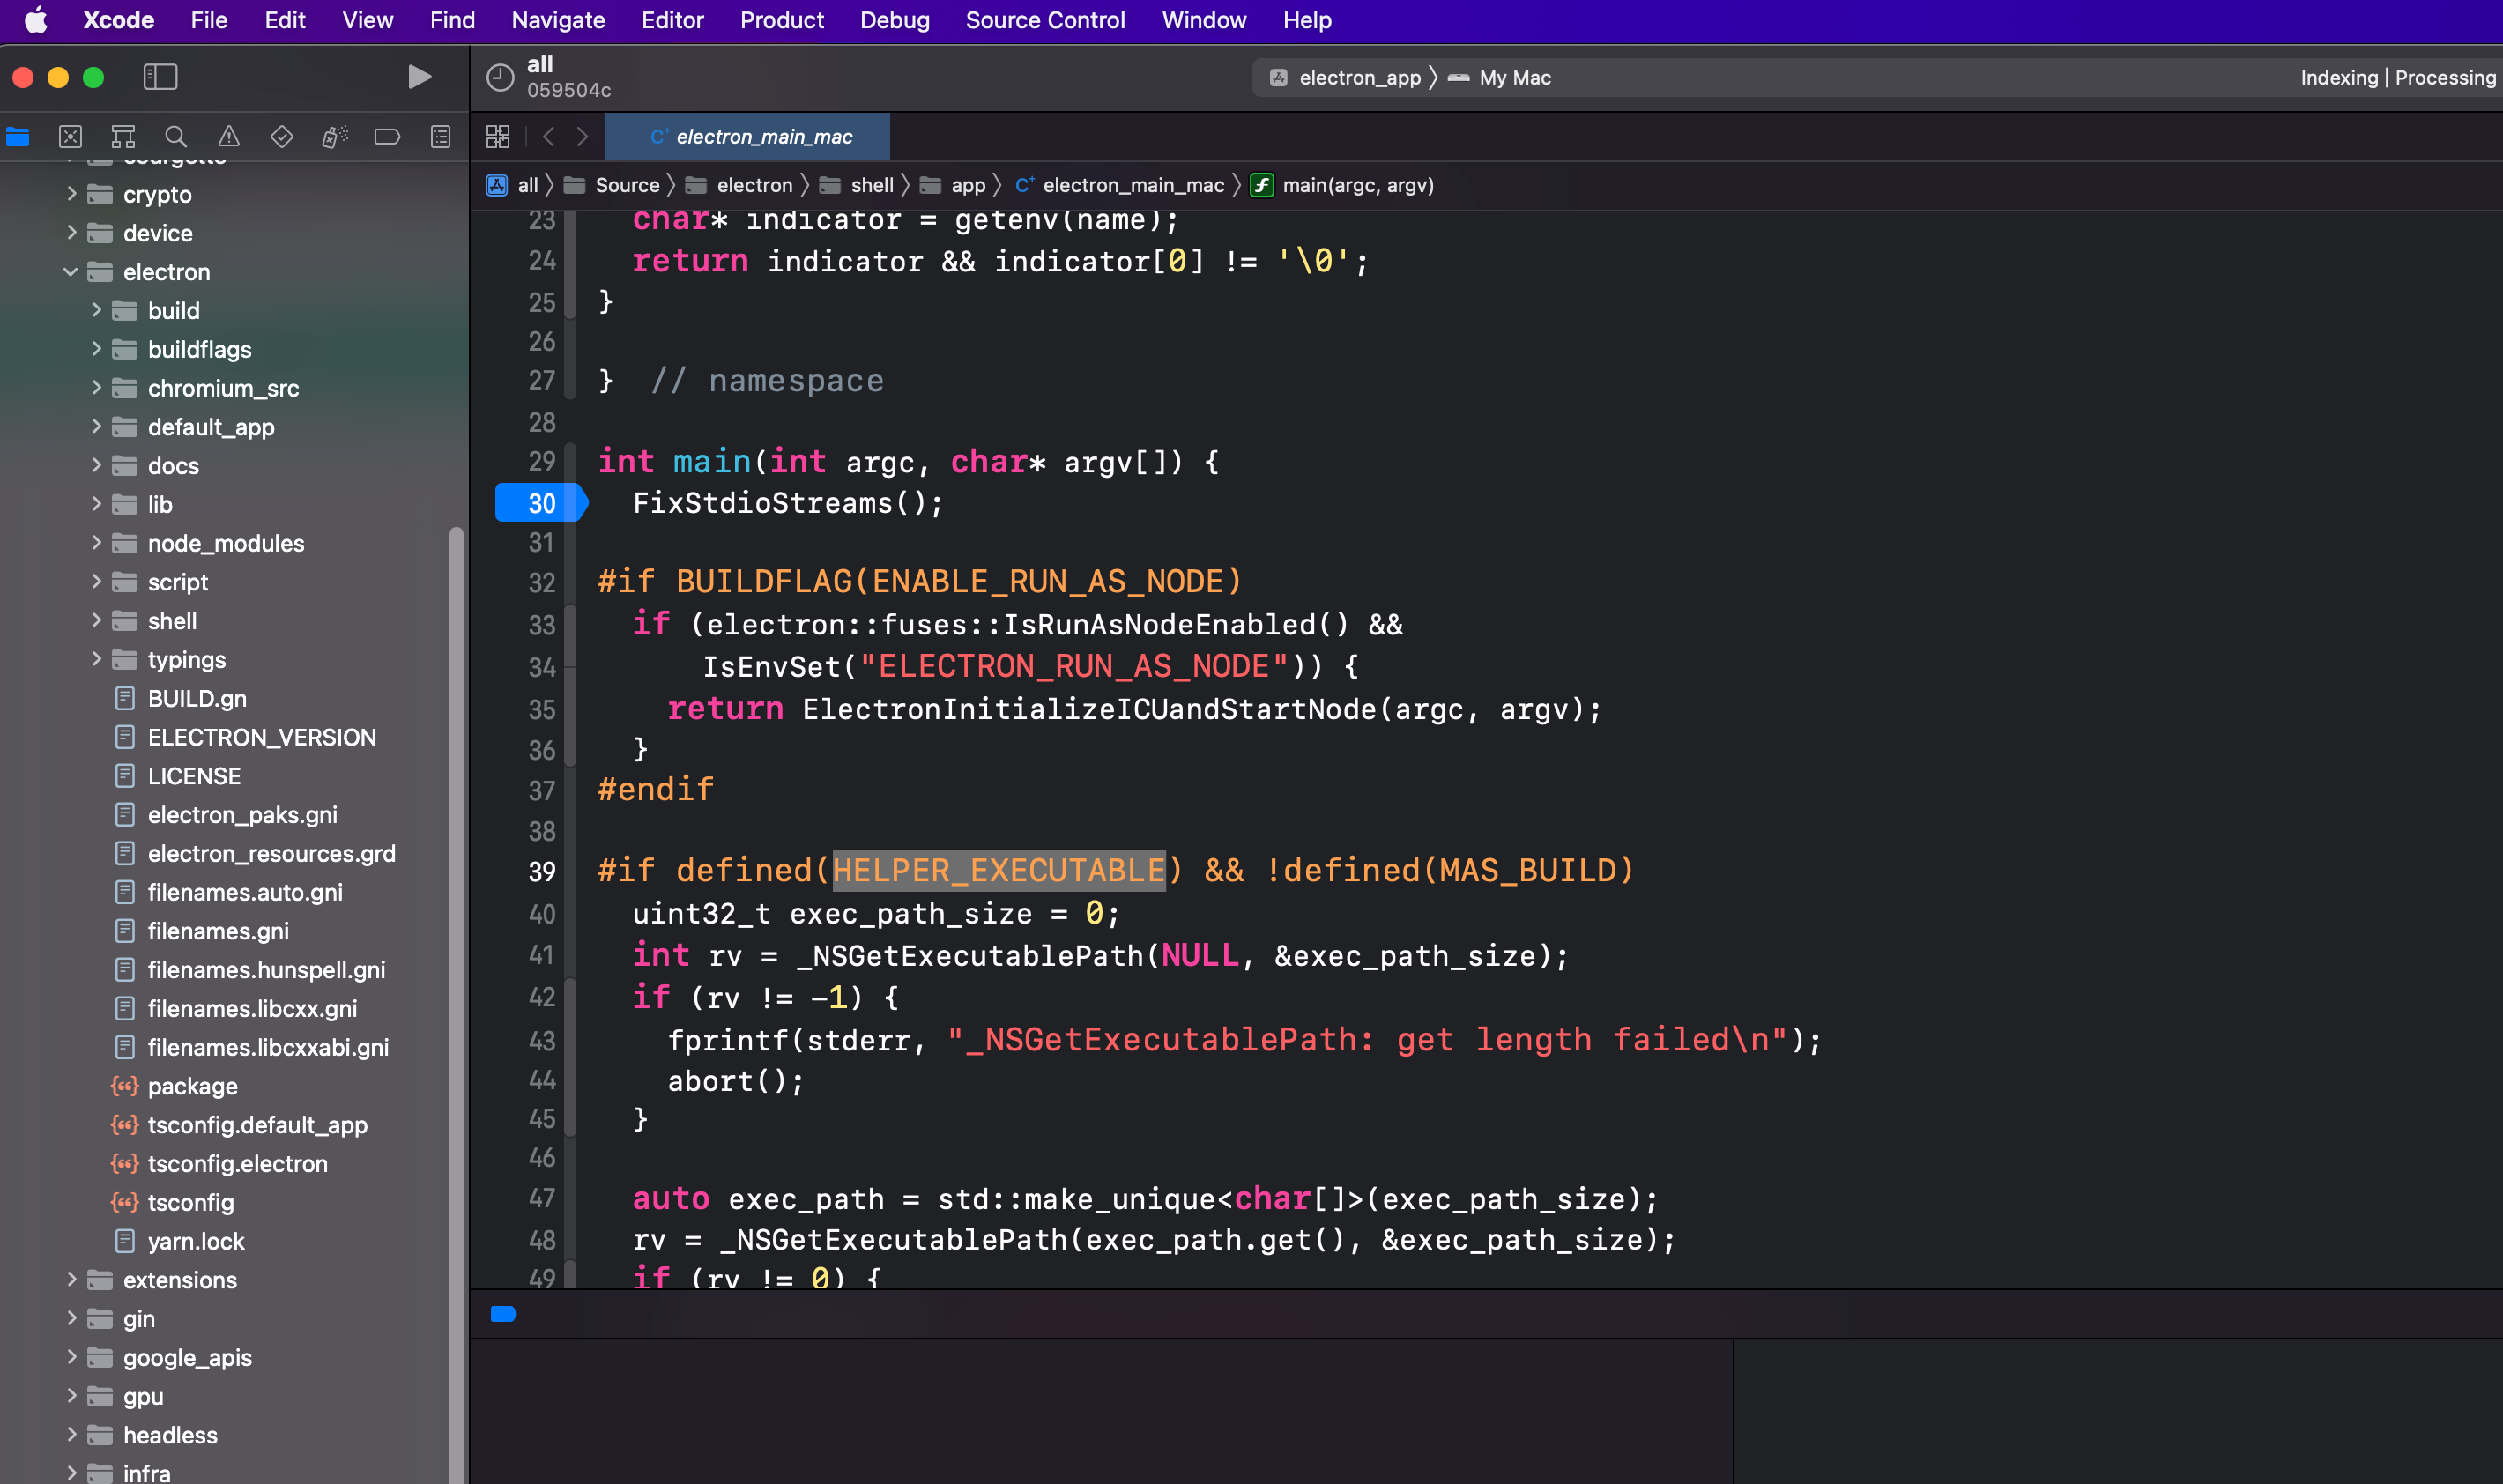
Now you can use LLDB or xcode for breakpoint debugging.
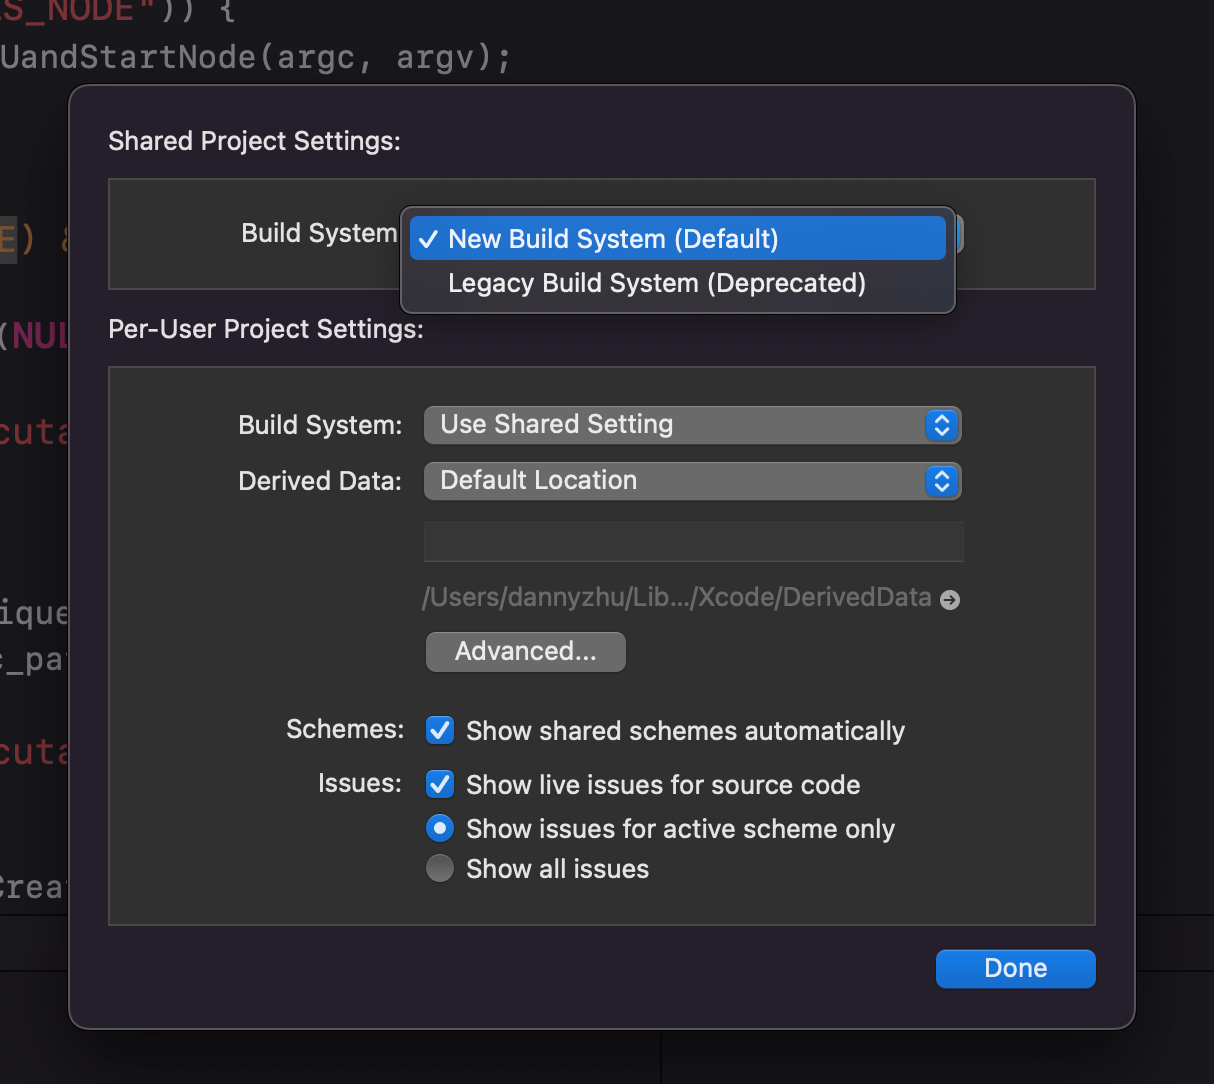
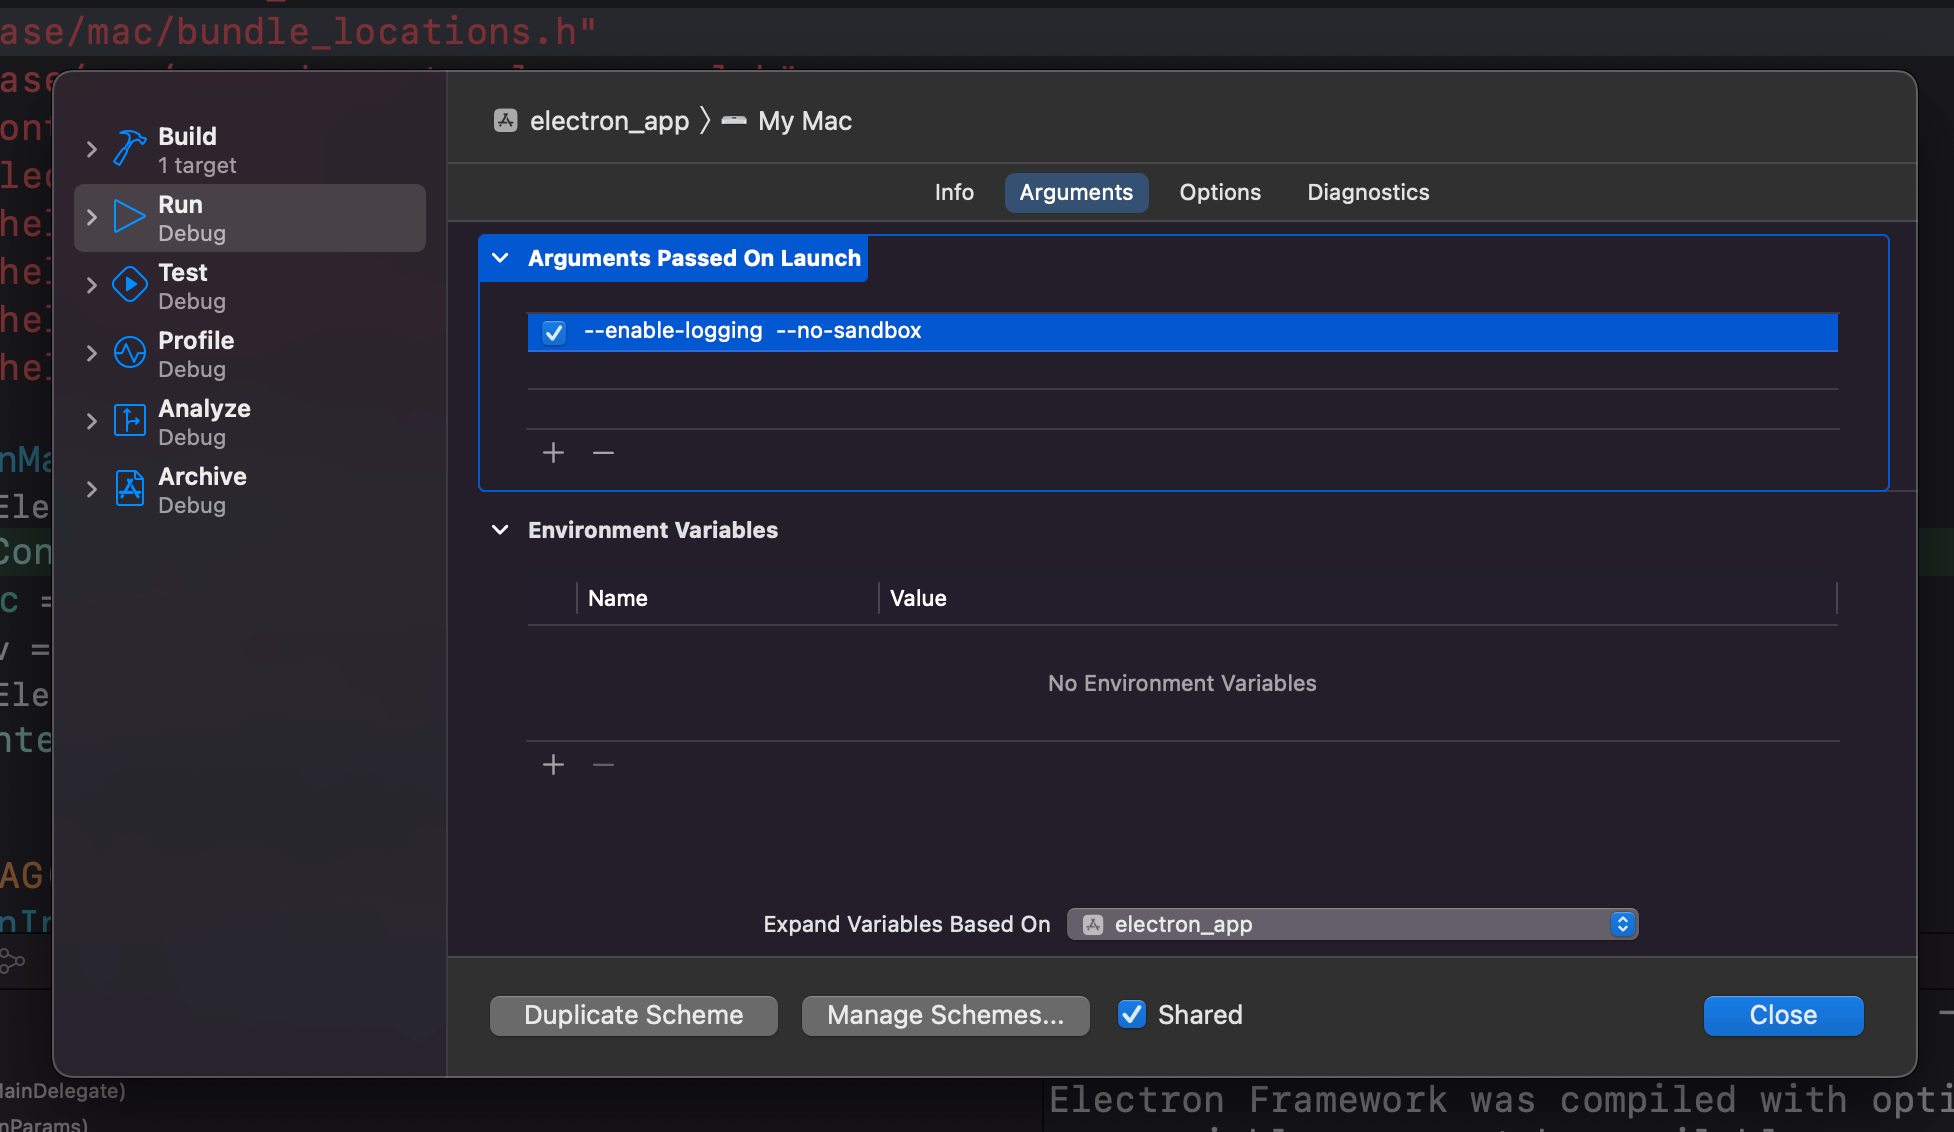
这里我习惯用xcode进行调试;打开 out/Debug目录下的 all.xcodeproj,在正式启动调试前,需要先将 project seetings -> Build system 改成 New Build System; 否则会无法启动
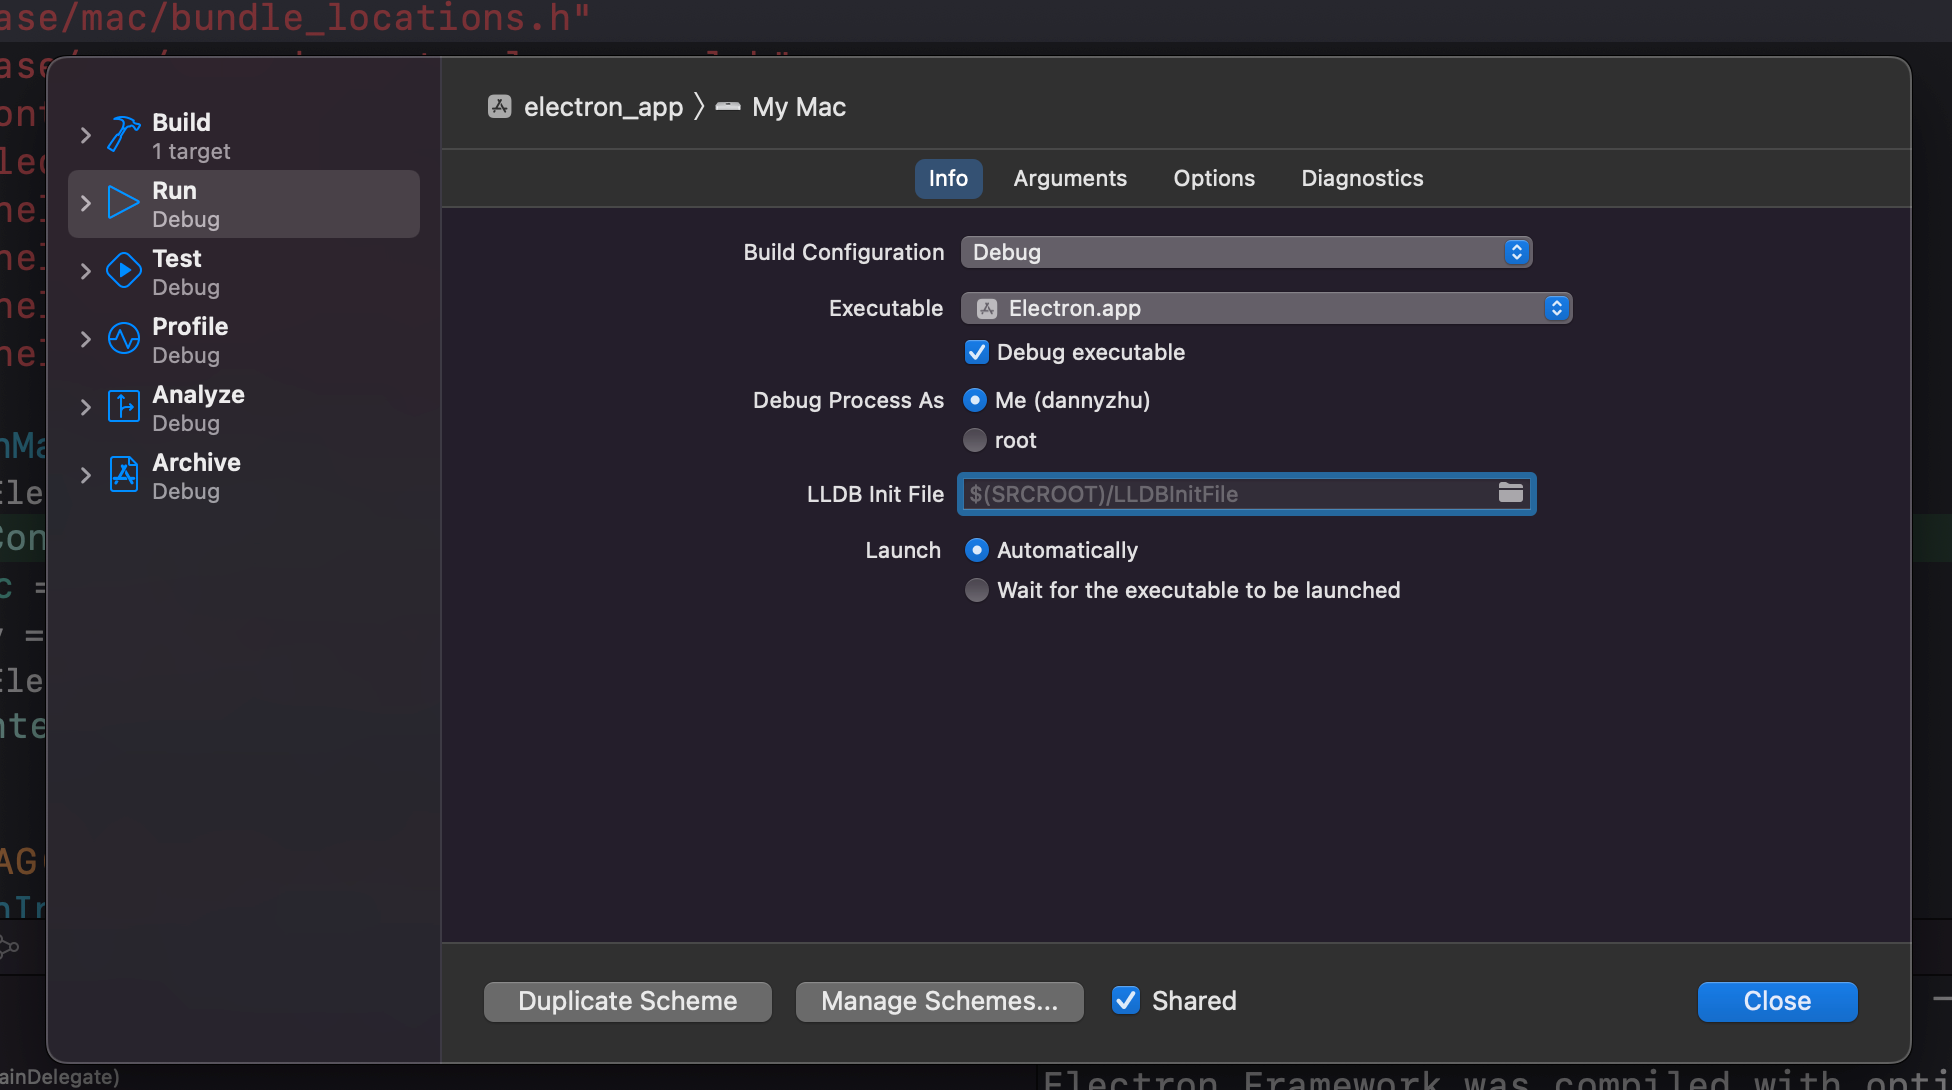
如果你希望看到更多的日志信息,可以在product -> scheme -> edit scheme 中, Executable 选择 Electron.app 设置启动参数 --enable-logging
Platform-Specific Debugging
Debugging with the Symbol Server
Debug symbols allow you to have better debugging sessions. They have information about the functions contained in executables and dynamic libraries and provide you with information to get clean call stacks. A Symbol Server allows the debugger to load the correct symbols, binaries and sources automatically without forcing users to download large debugging files.
For more information about how to set up a symbol server for Electron, see debugging with a symbol server.
